Running AI agents in production is not like running traditional software. Token costs accumulate continuously, latency spikes are unpredictable, and the messaging infrastructure that connects agents, subagents, and MCP servers all needs to perform reliably. Without observability, you are flying blind.
RockBot and its entire ecosystem — subagents, the research agent, MCP servers, and the internal messaging pipeline — are all instrumented with OpenTelemetry (OTel). This means every LLM request, every token consumed, every message dispatched, and every bit of latency is tracked and exported to the observability stack running in my Kubernetes cluster.
In my case, I host all the RockBot related services in my Kubernetes cluster, so this blog post focuses on what I’ve done. However, OTel is supported by all major cloud vendors and environments, and nearly any modern instrumentation or monitoring software works with it. As a result, the RockBot framework’s OTel support means that it plugs into Azure, AWS, or almost any other cloud seamlessly - in a manner similar to what I have set up in Kubernetes.
The OTel Stack in Kubernetes
The Kubernetes cluster runs a standard cloud-native observability stack:
- OpenTelemetry Collector — receives metrics, traces, and logs from all instrumented services and routes them to the appropriate backends
- Prometheus — scrapes and stores the time-series metrics data
- Grafana — provides dashboards and alerting on top of the collected data
Every component in the RockBot ecosystem—the primary agent, any spawned subagents, the research agent, and the various MCP servers—emits OTel metrics. This gives a unified, aggregated view across the entire agentic system rather than having to piece together logs from individual services.
What Gets Instrumented
Instrumentation falls into broad categories: LLM economics, agent usage, messaging pipeline health, operational health.
For example:
LLM Economics
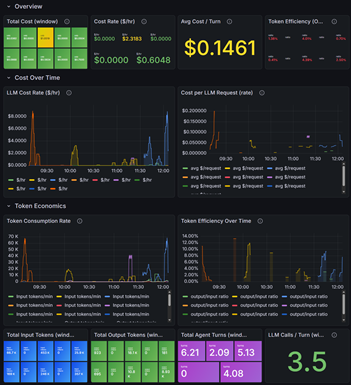
The economics dashboard captures everything related to the cost and efficiency of LLM calls:
- Cost rate ($/hr) and total cost (window) — how much is being spent on LLM inference right now and over a rolling window
- Avg cost per turn — the average spend per agent conversation turn, a useful signal for understanding task complexity trends
- Token consumption rate — input and output tokens per minute, broken down by model
- Token efficiency — the output/input token ratio over time; a rising ratio can indicate the agent is generating increasingly verbose responses
- LLM calls per turn — how many LLM invocations happen per agent turn, which helps identify whether subagent or tool orchestration is driving up call counts
At a glance, the current average cost per turn is $0.1461, with roughly 3.5 LLM calls per turn on average and a total of 6.21 agent turns tracked during the window.
LLM Request Throughput and Latency
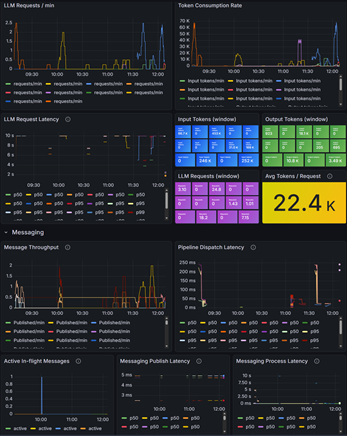
The usage dashboard digs into the raw mechanics of LLM calls:
- LLM requests/min — the request rate across all agents and services, showing traffic spikes as agents become active
- LLM request latency (p50/p95) — response times from the LLM backends, with percentile breakdowns to surface tail latency issues
- Input/output tokens (window) — rolling token totals by model
- Avg tokens/request — currently sitting around 22.4K tokens per request, reflecting the context window sizes in use
Latency and throughput together tell you whether the LLM routing layer is performing well. If p95 latency climbs while request rate is low, that’s a signal to investigate the upstream model providers or the routing-stats MCP server.
Messaging Pipeline
RockBot uses an internal messaging pipeline to coordinate between the primary agent, subagents, and the various background services. The messaging section of the usage dashboard tracks:
- Message throughput (published/min) — how many messages are flowing through the pipeline
- Pipeline dispatch latency — how long it takes from a message being enqueued to it being dispatched (p50/p95)
- Active in-flight messages — the current backlog of unprocessed messages
- Messaging publish latency — the time to write a message to the pipeline
- Messaging process latency — the time from pickup to completion on the consumer side
This is particularly useful for spotting backpressure. If in-flight messages climb while throughput stays flat, something downstream is stalling—whether that’s a subagent blocked on a slow tool call, or an MCP server under load.
⚠️ I know people tend to favor using the HTTP protocol because it is well-understood and deterministically synchronous. In reality though, a queued messaging system is far more resilient, cheaper, and easier to manage. RockBot supports both models, but I almost always default to queued messaging when given a choice.
Alerting
Having dashboards is only half the value. The real payoff is alerts. Grafana alert rules fire on conditions like:
- Cost rate exceeding a threshold (unexpected runaway agent behavior)
- LLM request latency p95 spiking (model provider degradation)
- Message pipeline backlog growing beyond a threshold (subagent stalls)
- Token consumption rate anomalies (prompt injection or unexpected task expansion)
Alerts land in whatever notification channel you configure—Slack, PagerDuty, email, or any other Grafana-supported contact point.
Why This Matters
Observability for agentic systems isn’t optional—it’s a prerequisite for running them reliably at any scale. A single misconfigured tool or a prompt that causes an agent to loop can silently burn through token budget before anyone notices. An MCP server with degraded performance can cause cascading latency throughout the entire agent ecosystem.
By instrumenting everything with OTel and aggregating it in Grafana, you get:
- Cost visibility — know what you’re spending and catch runaway costs early
- Performance baselines — understand normal latency so anomalies stand out
- Pipeline health — ensure the messaging backbone connecting your agents is functioning correctly
- Audit trail — metrics data supports post-incident analysis when something goes wrong
The RockBot ecosystem is designed so that every new agent, every new MCP server, and every new subsystem emits OTel metrics by default. As the system grows—more agents, more MCP integrations, more automation—the observability grows with it automatically.
If you’re building production agentic systems, treat OTel instrumentation as a first-class requirement, not an afterthought.